Nate Silver - My new New York Times magazine article about President Obama’s re-election prospects is up. This represents an update to an article in November, when Mr. Obama’s chances looked quite a bit worse than they do now.
The article, like the previous one, relies in part on a simple forecasting model that accounts for a president’s current approval rating, and then allows you to input various economic results as measured by growth in gross domestic product from now to the election.
Given Mr. Obama’s current approval ratings and consensus forecasts on the economy, he rates as about a 60 percent favorite to win the popular vote against Mitt Romney, with somewhat higher chances against any of the other Republicans running for the nomination. By contrast, in the November version of the model, Mr. Obama was an underdog to Mr. Romney, with a 40 percent chance of winning; the president’s approval ratings were about 6 points lower then and economic forecasts were somewhat more pessimistic.
The model also measures the strength of Mr. Obama’s potential opponents on the basis of an ideology score — the empirical evidence is fairly clear, in my view, that opponents who are closer to the center of the electorate are more likely to outperform the fundamentals than those that are more toward the wings.
The ideology scores have been refined somewhat from the previous version of the model and now represent a composite of four objective measures of ideology:
(A technical note: the DW-Nominate scores, which are based on Congressional voting records, are used as the common denominator between the various systems. For instance, I compared the DW-Nominate scores for all current members of Congress to their OnTheIssues.org score. This allows me to come up with a rating for Mr. Romney that is on the same scale as DW-Nominate, even though he has never served in Congress.)
The various measures are in fairly strong agreement for Mr. Romney, who rates as exactly a 50 on the scale. (Meaning, he is essentially a “generic Republican.”) And all of the measures see Newt Gingrich as somewhat more “extreme” than the typical presidential nominee; he comes out at 68 on the scale.
There is somewhat more disagreement on the other two candidates. Rick Santorum rates as extremely conservative based on his OnTheIssues score and on the perception that voters have of him — but his Congressional voting record had streaks of moderation. (Some of the difference comes from the fact that measures like Mr. Santorum’s DW-Nominate score tend to place more emphasis on economic issues, whereas voter perceptions about his ideology may depend more upon his views on social issues.) Over all, his score comes out at 68, the same as Mr. Gingrich.
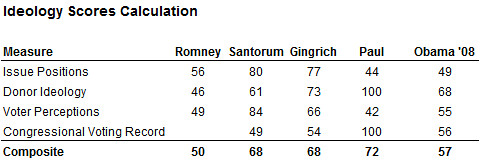
Ron Paul is an exceptionally challenging candidate to rate on any left-right scale, but I gave it a try and he comes out at 72, not meaningfully different from Mr. Santorum or Mr. Gingrich. Measures that focus on economic voting, like DW-Nominate, see Mr. Paul as extreme, while on social issues he is all over the map. (I capped the scores for each of the individual measures at 100 so as not to let any of them dominate the composite rating too much.)
Mr. Obama, if measured on the same basis in 2008, would have come out as a 57. However, note that the model does not consider the incumbent’s ideology rating because concerns that voters have about it should already be priced into his approval rating, which the model does evaluate.
If G.D.P. grows at 2.5 percent from now through November — that is the current consensus forecast in the Wall Street Journal panel of economists — Mr. Obama would be a 60 percent favorite to win the popular vote against Mr. Romney, and a 77 percent favorite against Mr. Santorum.
If you have a different guess about what economic growth will be like, you can input it into the interactive that accompanies Sunday’s article. The model posits that all of the Republican candidates would rate as favorites to defeat Mr. Obama if the economy goes back into recession, for instance.
That the model accounts for these factors should not be taken to mean that other issues pertinent to the election are irrelevant. (In a follow-up article, for instance, I will discuss some reasons why the “electability gap” between Mr. Romney and Mr. Santorum might be narrower than the model implies.) Instead, it is meant to provide for a reasonable benchmark.
The model is not a substitute for the full-fledged version of the FiveThirtyEight model, which will be unveiled in the spring, once head-to-head polling becomes more plentiful and more reliable.
There are several other fundamentals-based models with this general structure, and most of them are worth looking at, but there are a couple of advantages that I see this model as having.
First, it is more explicitly designed with forecasting in mind (rather than retrospective evaluation of what happened). It treats the president’s current approval rating as representing the known factor and economic performance from now through November as an unknown factor, allowing you to test an array of economic outcomes.
Second, the model acknowledges that the identity of the Republican opponent could make some difference. Certainly there is room for debate about the right way to go about this or exactly how strong the effect might be. But models that make no effort to account for this may be not be properly specified.
Some models look, for instance, at the number of terms that a party has been in office, a factor that would favor Mr. Obama since Democrats just took over four years ago. Historically, however, this has been strongly correlated with the ideology of the opposition-party nominee: parties have tended to nominate more extreme candidates in their first term out of office. In my view, these models mistake the correlation for causation and come up with some implausible outcomes as a result. (One model, for instance, implies that Mr. Obama would be a slight favorite against Mr. Romney even if G.D.P. growth declines to 0 percent in the summer and even if his approval rating reverts to about 42 percent.)
Finally, the FiveThirtyEight model has tended to produce results that are reasonably close to those at betting markets like Intrade, perhaps a sign that the model is handling these issues in a sensible way. By contrast, one popular model implies that Mr. Obama would be a better than 90 percent favorite if economic growth goes according to the forecast — while another would peg him as more than a 90 percent underdog if the same forecasts hold true. By definition, one of those models will turn out to be “right,” but both in my view are poorly designed.
Incidentally, you could come up with an otherwise identical model that substituted the the rate of payroll jobs growth for G.D.P. as its economic variable. Such a model would come up with virtually the same results, however; it would make Mr. Obama a 62 percent favorite to win the popular vote against Mr. Romney and a 74 percent favorite against Mr. Santorum, given current jobs growth forecasts.
The article, like the previous one, relies in part on a simple forecasting model that accounts for a president’s current approval rating, and then allows you to input various economic results as measured by growth in gross domestic product from now to the election.
Given Mr. Obama’s current approval ratings and consensus forecasts on the economy, he rates as about a 60 percent favorite to win the popular vote against Mitt Romney, with somewhat higher chances against any of the other Republicans running for the nomination. By contrast, in the November version of the model, Mr. Obama was an underdog to Mr. Romney, with a 40 percent chance of winning; the president’s approval ratings were about 6 points lower then and economic forecasts were somewhat more pessimistic.
The model also measures the strength of Mr. Obama’s potential opponents on the basis of an ideology score — the empirical evidence is fairly clear, in my view, that opponents who are closer to the center of the electorate are more likely to outperform the fundamentals than those that are more toward the wings.
The ideology scores have been refined somewhat from the previous version of the model and now represent a composite of four objective measures of ideology:
These measures are then translated onto a scale that runs from 0 (a true centrist) to 100, where a score of 50 represents the average opposition party nominee in presidential election years since 1944. Ratings for past candidates from 1944 to 2004 are taken from the book “The Party Decides” and were themselves determined from a composite of measures.
First, a candidate’s Congressional voting record as measured by the system DW-Nominate, developed by
the political scientist Keith Poole and a team of five colleagues. (This does not apply to Mr. Romney since he never served in Congress, but it works for the other candidates.)
Second, an average of recent polls from The Associated Press, Gallup and YouGov that asked voters to rate each candidate’s ideology on a five-point scale from liberal to conservative.
Third, a system developed by the political scientists Adam Bonica and Kevin Collins that rates candidates’ ideology based on the identity of their campaign contributors.
And fourth, the candidate’s ideology as estimated by the Web site OnTheIssues.org, a nonprofit (and avowedly nonpartisan) site that tracks public statements the candidates have made on a series of 20 issues and then estimates their place on the ideological spectrum on economic and social issues.
(A technical note: the DW-Nominate scores, which are based on Congressional voting records, are used as the common denominator between the various systems. For instance, I compared the DW-Nominate scores for all current members of Congress to their OnTheIssues.org score. This allows me to come up with a rating for Mr. Romney that is on the same scale as DW-Nominate, even though he has never served in Congress.)
The various measures are in fairly strong agreement for Mr. Romney, who rates as exactly a 50 on the scale. (Meaning, he is essentially a “generic Republican.”) And all of the measures see Newt Gingrich as somewhat more “extreme” than the typical presidential nominee; he comes out at 68 on the scale.
There is somewhat more disagreement on the other two candidates. Rick Santorum rates as extremely conservative based on his OnTheIssues score and on the perception that voters have of him — but his Congressional voting record had streaks of moderation. (Some of the difference comes from the fact that measures like Mr. Santorum’s DW-Nominate score tend to place more emphasis on economic issues, whereas voter perceptions about his ideology may depend more upon his views on social issues.) Over all, his score comes out at 68, the same as Mr. Gingrich.
Ron Paul is an exceptionally challenging candidate to rate on any left-right scale, but I gave it a try and he comes out at 72, not meaningfully different from Mr. Santorum or Mr. Gingrich. Measures that focus on economic voting, like DW-Nominate, see Mr. Paul as extreme, while on social issues he is all over the map. (I capped the scores for each of the individual measures at 100 so as not to let any of them dominate the composite rating too much.)
Mr. Obama, if measured on the same basis in 2008, would have come out as a 57. However, note that the model does not consider the incumbent’s ideology rating because concerns that voters have about it should already be priced into his approval rating, which the model does evaluate.
If G.D.P. grows at 2.5 percent from now through November — that is the current consensus forecast in the Wall Street Journal panel of economists — Mr. Obama would be a 60 percent favorite to win the popular vote against Mr. Romney, and a 77 percent favorite against Mr. Santorum.
If you have a different guess about what economic growth will be like, you can input it into the interactive that accompanies Sunday’s article. The model posits that all of the Republican candidates would rate as favorites to defeat Mr. Obama if the economy goes back into recession, for instance.
That the model accounts for these factors should not be taken to mean that other issues pertinent to the election are irrelevant. (In a follow-up article, for instance, I will discuss some reasons why the “electability gap” between Mr. Romney and Mr. Santorum might be narrower than the model implies.) Instead, it is meant to provide for a reasonable benchmark.
The model is not a substitute for the full-fledged version of the FiveThirtyEight model, which will be unveiled in the spring, once head-to-head polling becomes more plentiful and more reliable.
There are several other fundamentals-based models with this general structure, and most of them are worth looking at, but there are a couple of advantages that I see this model as having.
First, it is more explicitly designed with forecasting in mind (rather than retrospective evaluation of what happened). It treats the president’s current approval rating as representing the known factor and economic performance from now through November as an unknown factor, allowing you to test an array of economic outcomes.
Second, the model acknowledges that the identity of the Republican opponent could make some difference. Certainly there is room for debate about the right way to go about this or exactly how strong the effect might be. But models that make no effort to account for this may be not be properly specified.
Some models look, for instance, at the number of terms that a party has been in office, a factor that would favor Mr. Obama since Democrats just took over four years ago. Historically, however, this has been strongly correlated with the ideology of the opposition-party nominee: parties have tended to nominate more extreme candidates in their first term out of office. In my view, these models mistake the correlation for causation and come up with some implausible outcomes as a result. (One model, for instance, implies that Mr. Obama would be a slight favorite against Mr. Romney even if G.D.P. growth declines to 0 percent in the summer and even if his approval rating reverts to about 42 percent.)
Finally, the FiveThirtyEight model has tended to produce results that are reasonably close to those at betting markets like Intrade, perhaps a sign that the model is handling these issues in a sensible way. By contrast, one popular model implies that Mr. Obama would be a better than 90 percent favorite if economic growth goes according to the forecast — while another would peg him as more than a 90 percent underdog if the same forecasts hold true. By definition, one of those models will turn out to be “right,” but both in my view are poorly designed.
Incidentally, you could come up with an otherwise identical model that substituted the the rate of payroll jobs growth for G.D.P. as its economic variable. Such a model would come up with virtually the same results, however; it would make Mr. Obama a 62 percent favorite to win the popular vote against Mr. Romney and a 74 percent favorite against Mr. Santorum, given current jobs growth forecasts.
No comments:
Post a Comment